The role of testing
Testing verifies that our process is proceeding satisfactorily. Since amateur mirror making uses several processes, we use several tests. Starting from a smooth spherical mirror surface free of astigmatism, the mirror maker gradually changes the mirror's shape from spherical to parabolic by preferential polishing. The Matching Ronchi test helps the mirror maker continually monitor progress. Steady progress increases the chances of a quality result and builds confidence. The Ronchi tester is made from simple materials, is easy to understand and quickly executed, allowing the mirror maker to concentrate on the mirror. Here's how I integrate the Matching Ronchi into the parabolizing process.
About the Ronchi test
Foucault mentions a grid test in 1857 that reminds me of the 2D Ronchi test. See an English translation at Foucault/LeonFoucaultArticle.html.
The Ronchi test, discovered by Vasco Ronchi in 1923, is one of the most versatile and easy to use tests. It is an interferometer that can be used geometrically. There is a large body of literature about the Ronchi test. For a review, see Malacara's, 'Optical Shop Testing', second edition, chapter 9, 'Ronchi Test'. I use the test geometrically which measures the transverse aberration (the Foucault test measures longitudinal aberration).
There are a number of variants of the Ronchi test including my null Ronchi test, my Ronchi Grid test, my Ronchi Tape Band test, the Mosby, the Null Ronchi, the Ronchi Star Test, the Concentric Grid Ronchi, the Phase Shifting Ronchi Test, the Sideband Ronchi Test, the Lower Test, and the Ronchi-Hartmann tests. I'm convinced that there are variations on the Ronchi waiting to be discovered and characterized.
I've successfully figured dozens of superb mirrors over many years using the Ronchi Test with recent notable examples being
I have led mirror making classes using the Ronchi as the principal test. I had a 6 inch F4 checked with the Hartmann test. The surface was 1/20 wave peak to valley and the RMS was 1/60 wave.
History of my Ronchi Calculator:
- 1992 computerized Ronchigrams: compare next to the Ronchi tester
- 2018 Matching Ronchi, matching pasted Ronchigrams over the computed bands
- 2020 Ronchi tape band quick test
- 2023 Null and Grid tests
Dr. Sherman Schultz
One of the most successful practitioners was Dr. Sherman Schultz of Macalester College in St Paul Minnesota. He used the Ronchi test in his mirror making classes with countless students successfully completing their telescopes.
Here's an interview with Dr Schultz. See Telescope Making #9 for an article by Dr Schultz on the Ronchi test.
He lists the following advantages of the Ronchi test.
- Ease of interpretation. Leads to confidence which leads to a better mirror surface. Getting mired down in numbers, spreadsheets and equipment adjustments isn't confidence inspiring.
- His students made 275 mirrors. Not a single student gave up or quit. Testing can be the point of failure for telescope makers. But not with the Ronchi test.
- The Ronchi test is sensitive enough to distinguish between excellent, good, fair and poor. Every little irregularity is seen. It doesn't matter if the error is 1/6 or 1/8 wave - you don't need to know the magnitude of the error. A drowning person doesn't need to know how deep the water is once he is in over his head. He just needs to know how to swim.
- You work until the curves match. The curves are not a mysterious table of numbers or a grid of coefficients. You can see the perfect simulated curve; remember it in your mind's eye. Each mirror diameter and focal ratio combination along with the grating frequency has its own curve.
- You can easily detect, better than any other test, the most common issue, that of turned edge. And the next most common issue, zonal roughness.
- The student immediately recognizes the overall curve as compared to the sphere. The correct corrective action is quickly devised. There is no plotting of the mirror profile as reconstituted from zonal measurements, which by the way, misses issues between the arbitrarily designated zones.
- The test image is bright. The Ronchi test can be used in an ordinarily lit room in daytime. It's easy to setup, easy to see, easy to understand.
Dennis Rech's comments, inventor of the Mirror-O-Matic mirror grinding machine
'When someone asks me to look at their mirror, I have them send me the parameters of the mirror and then I use a Ronchi program to show them what the Ronchi pattern should look like. We then print out the pattern on my big printer at exact scale and tape it to the back of the mirror. We then trace the Ronchi lines onto the front of the mirror with a Sharpie and then test it. And then, within seconds they can see exactly what their mirror should look like compared to what it actually is. A spherical mirror shows straight lines and as the center is lowered towards a parabola, the lines bow outwards. The deeper the curve, the more the lines bow. When the bowed Ronchi lines exactly meet the Sharpie lines, we have a parabola. Lines not bowed enough, rub a little more. Lines too bowed, rub everything else a little more. Lines all wonky, rub only the zones with flat lines or go back and correct the sphere. It is fast, it is accurate and one sees the entire mirror surface, not just a line of a couple of zones across the mirror. When Carl Zambuto first tried machine fabrication, he commented on the wonderful figure of revolution that comes from using a machine vs hand work. The Ronchi test shows this immediately, Foucault does not.'
Bob May's comments are at http://bobmay.astronomy.net/misc/ronchitester.htm.
Mirror quality
The Danjon-Couder standard states two conditions:
- The mirror's surface should be as smooth as possible, and
- The overall peak to valley error on the mirror's surface should be a small fraction of the wavelength of light
I make mirrors to the best of my ability, regardless of how long it takes for two reasons:
- Our bias that may judge a mirror better than it really is
- I am keen to continually improve my mirror making technique
Ronchi accuracy
Matching the Ronchi bands:
- Side by side comparison: looking through the Ronchi grating while holding a printout or smartphone near. I've done some great mirrors with this approach, most notably a 20 inch F5 that I regularly used at 1000x (one night of perfect seeing I went to nearly 6000x). Other amateurs have made some excellent mirrors using this approach too. However, it takes very careful scrutiny. A lot of ghastly mirrors have been made this way too. Most authorities that critize the Ronchi test for subjectivity and inaccuracy are likely thinking of this manner.
- Overlaying a Ronchigram taken with a camera or phone onto the computer generated bands. I found this a leap forward: much easier to see small issues and to properly gauge overall correction. I've made most of my large fast mirrors with this, for example the twin 30 inch F2.7s and the example that I give above, my first fast mirror, a 13 inch F3.0.
- An alternative approach is the Ronchi Tape Band test. I use this while parabolizing: it is lightning quick and accurate. See the section elsewhere on this webpage or go here.
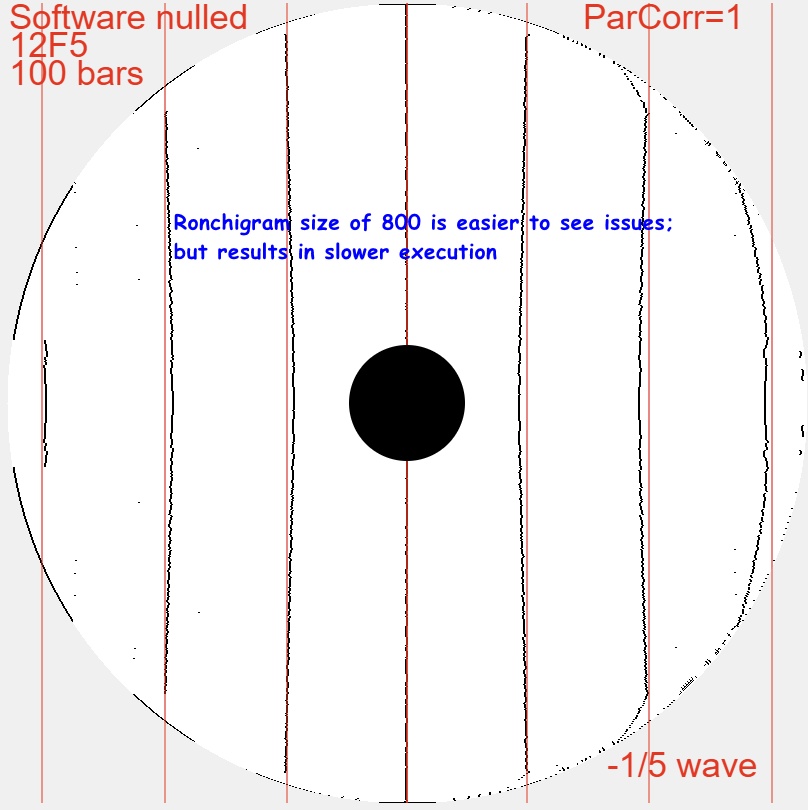
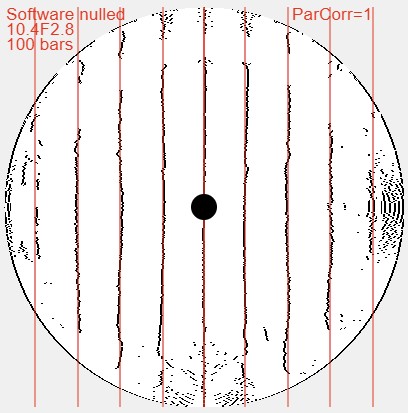
- The highest accuracy is achieved by software nulling then thinning the bands for sub-pixel resolution. This is equivalent to a DPAC (Double Pass AutoCollimation) test with reference lines. Here's what a 1/5 wavefront undercorrected 12 inch F5 mirror looks like.
Information is maximized and diffraction effects are minimized by selecting the grating frequency. This is good enough for our purposes: guiding our parabolization process while making a mirror, knowing that we conclude by adding the star test once snap focus at the eyepiece is achieved. Parabolize with the Matching Ronchi during the day, verify with the star test at night.
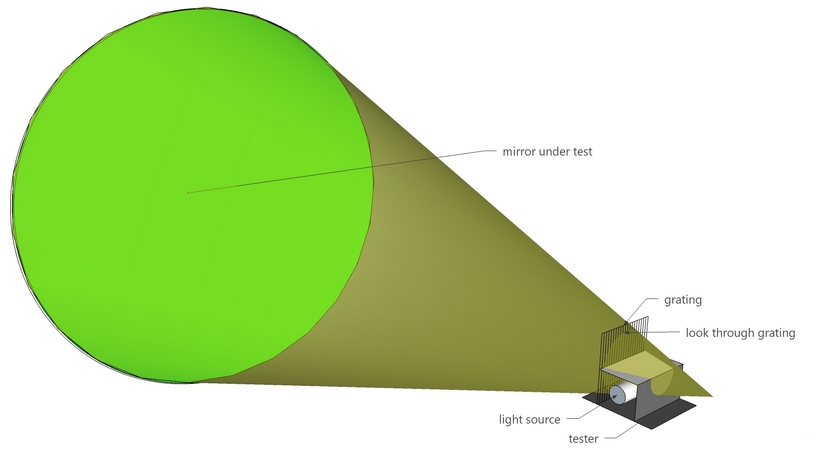
I think of it this way: The Ronchi tester is very simple: a ruled grid, a light source and a smartphone to take the Ronchigram. The mirror's information is there but difficult to get at. I use software to make the information available. Still, one has to inspect carefully. I consider this a reasonable trade-off. But accuracy is not enough. A test that is easy and quick to analyze lets us to mentally focus on the next corrective action enabling us to execute many sessions in a single evening.
Incidentally, a second test helps overcome the psychological tendency to optimistically overlook errors, hoping that our mirror will perform nicely. Seen from a different testing perspective, errors in the mirror are harder to ignore. Looking back, we can see them in the first testing method. Put another way, stand on a street corner, point up at the sky like you're spotting superman or superwoman. People ignore you - you're slightly wacko. Get a second person to join you, then a third. Now, people stop and ask what are you pointing at.
Increasing the resolution of the Ronchigram allows small errors to be more easily seen. Match the software setting's Ronchigram resolution to the size of the Ronchigram taken by the camera. Be careful of the camera lens' distortion which can significantly alter the apparent parabolization. Here is the same study at a size of 800x800.
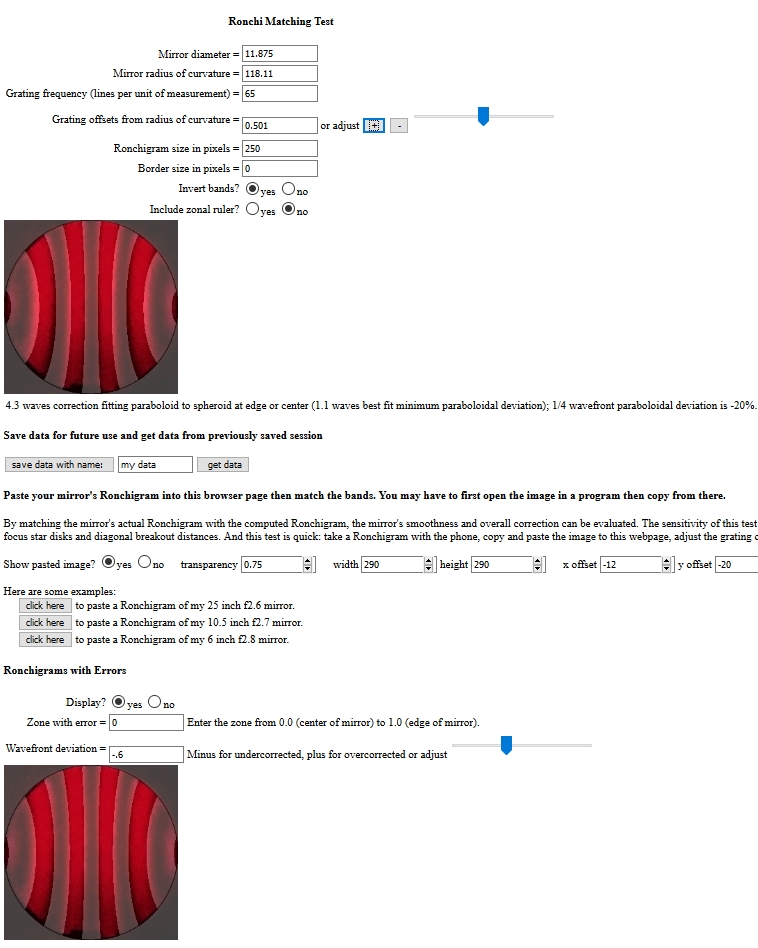
Comparing to interferometry
A friend who uses a Zygo interferometer at work sent me a Ronchigram of a commercial mass produced 12 inch [30cm] mirror. It was quite undercorrected. Using the matching tool above, I found that it was 0.6 wave undercorrected. After I communicated my results, he told me that the Zygo had found that the mirror had a spherical deviation of 3.7 waves when a fully corrected mirror should have a deviation of 4.3 waves. That is a difference of 0.6 waves, which matched my results. The first Ronchigram is the match to a perfect paraboloidal surface while the second Ronchigram is the match to the 0.6 wave undercorrected Ronchigram.
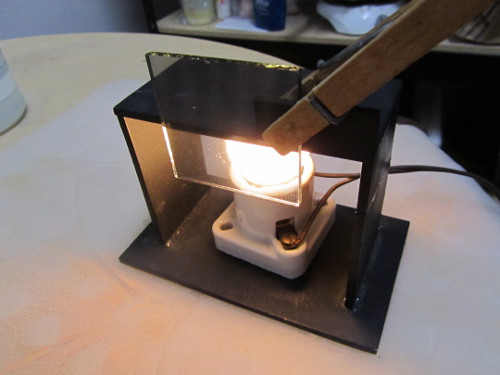
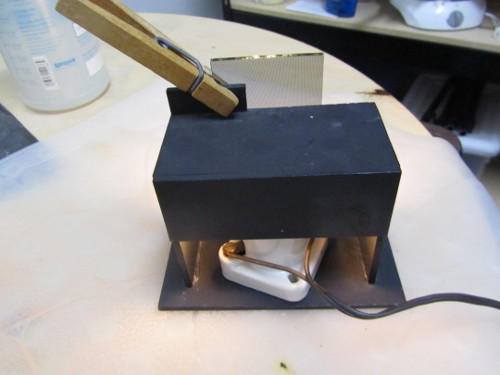
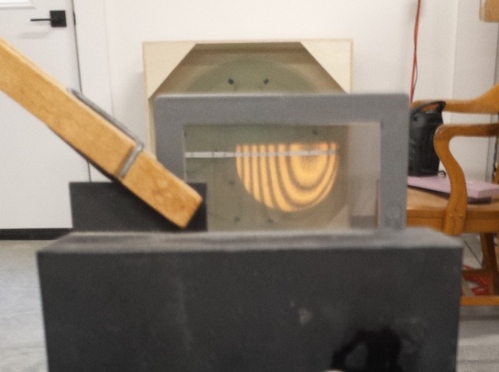
The tester
My trusty tester that I've used for countless mirrors over 40 years.
Instructions, how to use the Ronchi Calculator
See my 2023 presentation on using the Ronchi Calculator's matching, tape band and null tests, along with my followup 2024 presentation (go to the 4 hr mark).
Two steps:
- Take the Ronchigram then prep the image.
- Import the image into the Ronchi Calculator and analyze.
Take the Ronchigram then prep the image
For the null Ronchigram matchup, set up inside the radius of curvature (RoC) such that the bands bow outward in the mirror's center. Aim for a few bands across the mirror's face. Fewer bands means greater sensitivity while more bands mean more coverage of the mirror's area from center to edge.
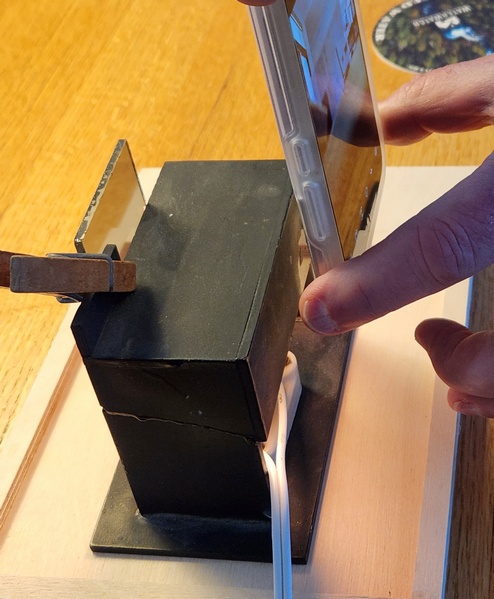
I use my smartphone to take the image through the my Ronchi tester. Try to center the Ronchigram by either placing a dark band or a bright band over the mirror's center. Precise centering is no longer necessary with the new null matching Ronchigram capability but it helps. Sometimes the phone picks up the grating just in front of the phone causing vertical striping. I ignore it. Smartphone cameras can distort the Ronchigram if it fills the camera view, is taken off-center, or the phone is tilted. So square-on the smartphone to the mirror when taking the Ronchigram.
I prep the image using a freeware image processing program like FastStone.
- Rotate the image so that the bands are vertically aligned.
- Crop the image top/bottom/left/right. I use masking tape stuck on the mirror's edges to clear up the diffraction that makes distinguishing the mirror's edges problematic. In fact, I can tell how fine of Ronchi grating by inspecting the diffraction. Otherwise adjust the left/right crop to match the top/bottom crop, forming a square.
- Resize to a comfortable number for the Ronchi Calculator. I like 400x400.
- Copy to the clipboard.
Import the image into the Ronchi Calculator and analyze
Set up the Ronchi Calculator for your mirror. The calculator needs you to select a unit of measurement, say inches or millimeters, then enter the mirror's diameter and grating frequency in those unit of measurements. The calculator also needs the focal ratio (or focal length or radius of curvature) to know how to computer the parabolic curves. The grating offset of your Ronchi tester is also needed.
- Enter the mirror diameter.
- Enter the radius of curvature, or the focal length or the focal ratio.
- Enter the Ronchi grating frequency. Be aware that some manufacturers double count the lines. If any doubt, use a magnifying lens and count the lines. The software expects you to enter the number of dark bands per unit of measurement. If 100 is entered, then you should count 100 dark bars and 100 light bars in your unit of measurement (inches, millimeters).
- Enter a single grating offset, eg, -0.2 for inside RoC or 0.5 for outside RoC. We'll adjust this later.
- Enter the Ronchigram size you set when prepping the image.
- Turn on 'Nulled ruler?'.
- For convenience, once you've entered these values you can save them for future use.
- Paste the image into the Ronchi calculator.
- Adjust the matching. Be prepared to turn on 'Invert bands?' if this makes it easier to see the bands. Looking at the null Ronchigram match, use the Grating offset adjustment slider to do two things at once:
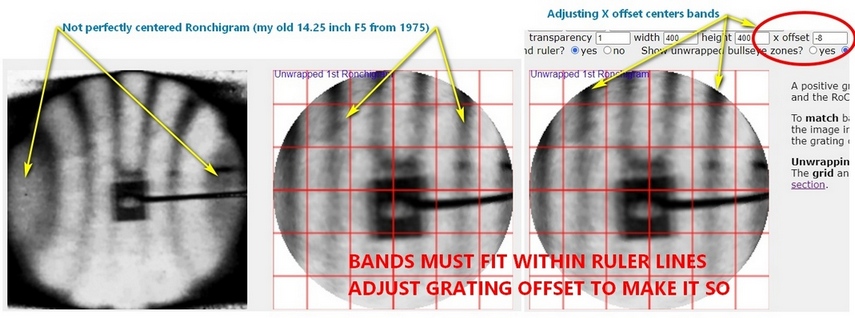
- Make the bands as straight as possible while fitting the bands within the red ruler.
- If the Ronchigram was not perfectly centered on the bands as this Ronchigram from 1975, then adjust using the 'x offset'.
If the bands are perfectly straight and fit perfectly within the red ruler marks, then you are done! This will not be the case though until the mirror is finished. What will be apparent is a bowing of the bands. Start analyzing by adjusting the 'Parab. correction =' value. If the bands bow outward in the center then the mirror is overcorrected. If the bands bow inward towards the center then the mirror is undercorrected. The goal is to make the bands straight by adjusting the parabolic correction. Note that you may have to adjust the grating offset during this process to keep the bands centered with respect to the red ruler markings.
By noting any turned edge and degree of parabolic correction, you will often know what needs to be done to the mirror. For how to accomplish the polishing action, see my parabolizing webpage.
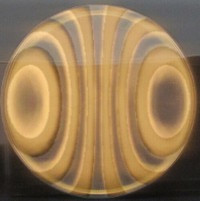
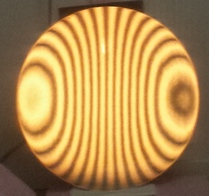
A study of my 16.25 x 3/8 inch [410x10mm] meniscus mirror. You can see that by selecting a grating offset inside the radius of curvature with a moderate number of bands, the standard Ronchigram shows good sensitivity towards the center of the mirror while the nulled Ronchigram shows good sensitivity at the mirror's edge. I am able to see grating tilt, smartphone tilt, mirror test stand and other issues more easily. The artifacts making the bands look rough are from the grating lines bleeding through the smartphone's image.
To use the zonal errors table, adjust the individual zonal corrections to best straighten the bands appearing in the Ronchigrams. Verify your zonal corrections by turning the zones on and off by selecting/deselecting the 'Use?' checkboxes. The results will appear in the Mirror Zonal Errors Profile graph.
Here's an example using the Zonal errors correction table to judge my finished 25 inch [64cm] F2.6 mirror.
Nulling a Ronchigram
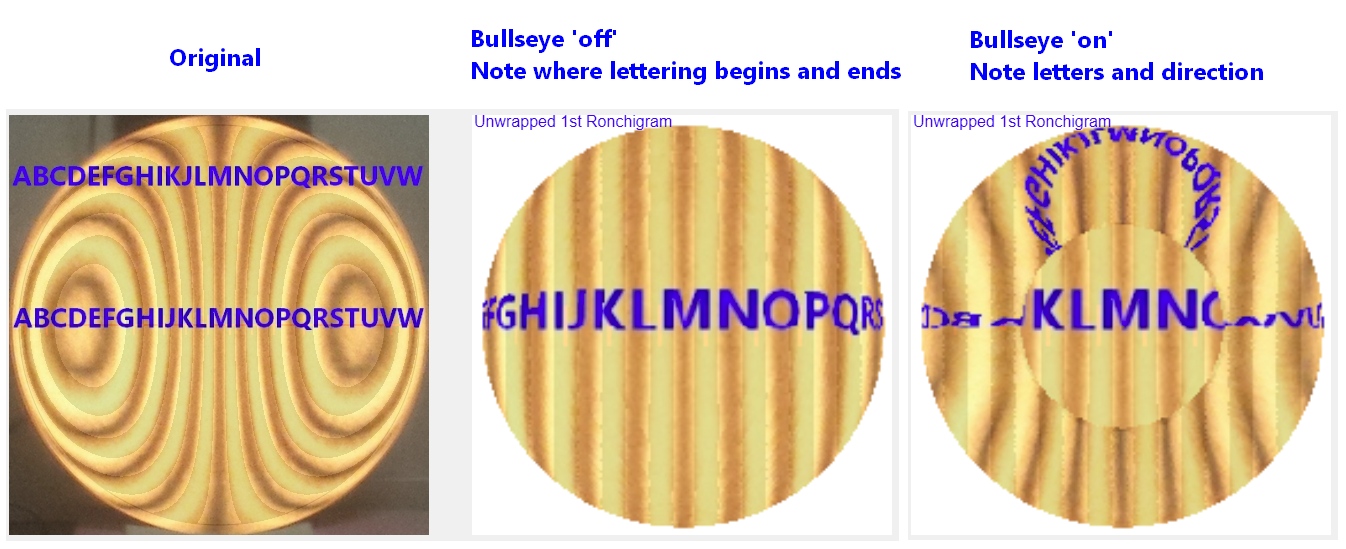
Nulling a Ronchigram removes the parabolic distortion, returning the bands to their straight and vertical appearance.
Note that nulled Ronchigram uses the zonal error table, consequently the calculated Ronchi bands are always nulled straight: whatever zonal errors that cause the first Ronchigram's calculated bands to distort from ideal are also used to null, removing the zonal error corrections from the calculated Ronchi bands. The pasted image is also nulled per the zonal correction table, resulting in the image's bands changing. I think of it this way: the standard Ronchigram does not distort the pasted image but the computed Ronchi bands do follow the zonal error table, allowing the bands to be matched to each other. The Mirror Zonal Errors Profile and wave error is computed from the zonal error table. Changes to the zonal error table alters the nulled image's bands straightness, the goal being to make the pasted image bands as straight as possible.
To make the nulled pasted image bands as straight as possible, if the mirror is undercorrected, then then zonal error will need to be overcorrected, that is, above 1. Similarly for an overcorrected mirror, then zonal error will need to be undercorrected, below 1.
Avoid nulling Ronchigrams with loops: the nulling loops back on itself. Use Ronchigrams with more, not less, bands.
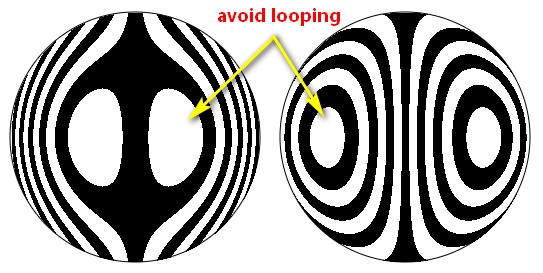
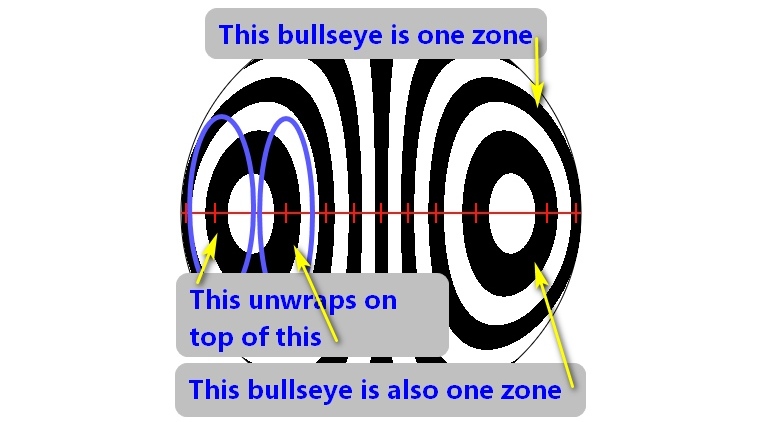
If nulling loops cannot be avoided then use the control, 'Show bullseye zones?', to show the portion of the bullseye that is otherwise hidden. Each bullseye is a zone that circles a point representing the radius of curvature of the bulleye's center. Nulling the bullseye into a bar means that one half of the bullseye will be nulled onto the other half.
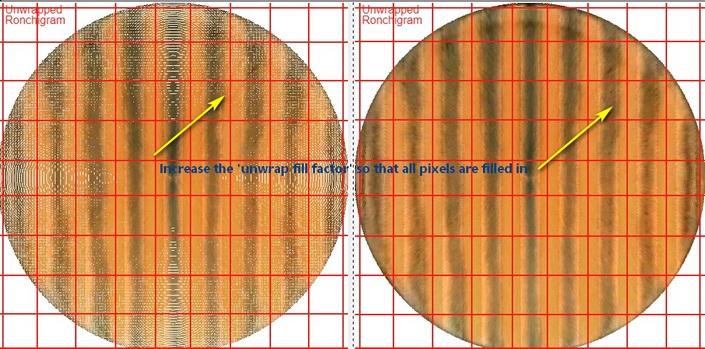
And if nulled pixels show up, increase the 'null fill factor' number.
The Matching Ronchi tape band variant
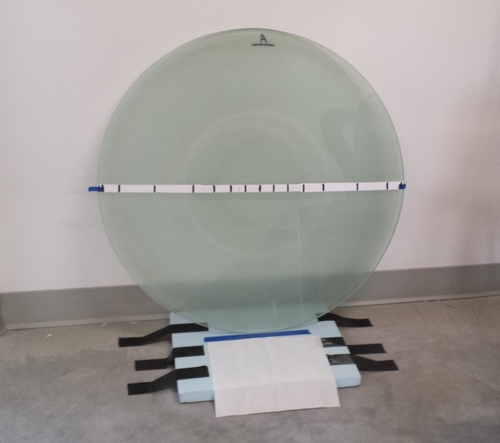
One can print out the Matching Ronchi image to scale and place it behind the mirror. Barring that, I invented a variant of the Matching Ronchi test while parabolizing twin 30 inch [76cm] F2.7 thin meniscus mirrors. I used it successfully on my 16.25 inch [41cm] F2.9 thin meniscus mirror.
Construct a tape that stretches across the mirror with marks indicating where the Ronchi bands cross very useful. The exact distances to the marks are given in the output data above. I can quickly see minute differences without resorting to taking a Ronchigram with my camera then matching up using the webclient software.
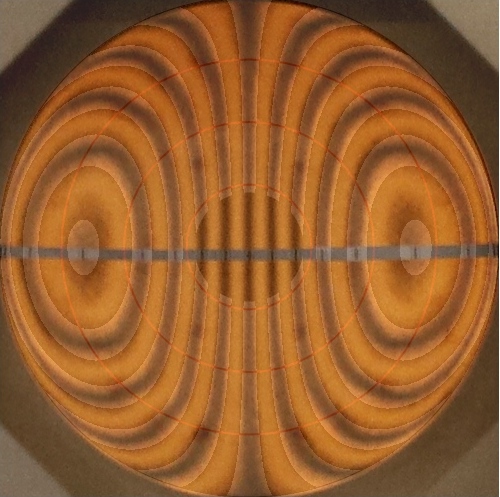
How good should the match be? Here are two images of the 30 inch F2.7 'B' mirror in progress. The first is early on. You can see that the mirror is short of full parabolization. The second is during the star testing phase showing a good match.
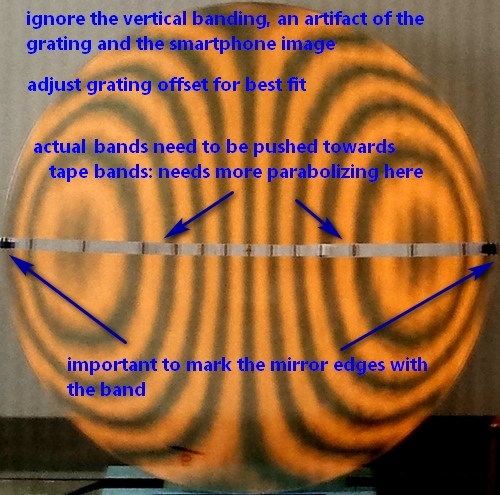
If a band is 'off' from its mark, the tester can be moved laterally, centering the band on the tape mark, noting the difference in thousands of an inch, e.g., by measuring the change angle of the turn of a threaded rod with knob and pointer. This zonal radius of curvature difference can be entered into the standard Foucault zonal measurements spreadsheet to calculate the wavefront error. Using this method, I found, at one point in parabolizing the 30 inch [76cm] F2.7 thin meniscus mirrors that the wavefront peak-valley error was 0.2 waves with the greatest deviation near the 80% zone. I then compared this result to the error portion of the Matching Ronchi test and found the best match Ronchigram to have an error of 0.2 waves at the 70% zone. This method is not intended to give rigorous wavefront ratings but instead to give an order of magnitude feeling to the error at hand.
Note that by convention, the band is colored on the mirror's face when the light ray passes through the grating. As a user I want to see the Ronchi Tape marks on the colored bands, which is logically inverted.
This test reminds of the Poor Man's Caustic test. Note that marking the edge of the mirror with the tape band improves Matching Ronchi results. Ronchigrams suffer from multiple edges (which, interestingly, can be used to deduce the bars per inch of the grating).
The grid test
Wouldn't it be easier to judge and measure if the bands could be straightened out? The Matching Ronchi null can be used as a full surface rectilinear grid test. Either make a grid Ronchi grating using it at the radius of curvature, or use a Hartmann mask over the mirror (the latter requires a pinpoint light source, for example, a laser with the lens removed and operated at less than lasing voltage). The Matching Ronchi grid software nulls the parabolically distorted image into a grid for easy inspection and measuring.
Turn on the Ronchi grid option so that the test can be used for 2-D full mirror testing.
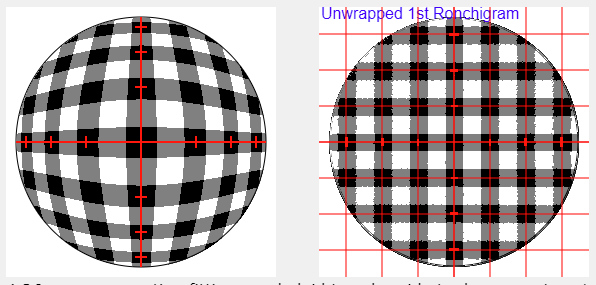
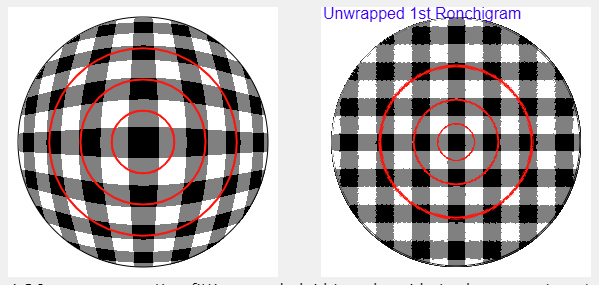
This Ronchigram grid shows the potential for the nulled grid version of the Matching Ronchi. A software version of the Ronchi-Hartmann 2D test? Here I crossed two gratings, attaching them to my Ronchi tester.
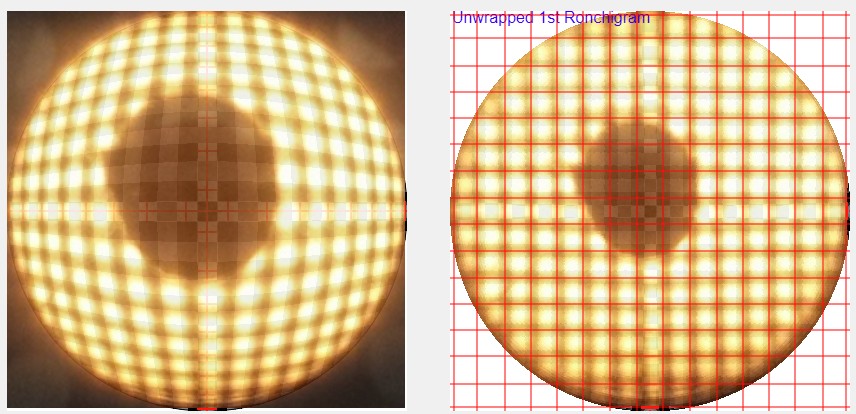
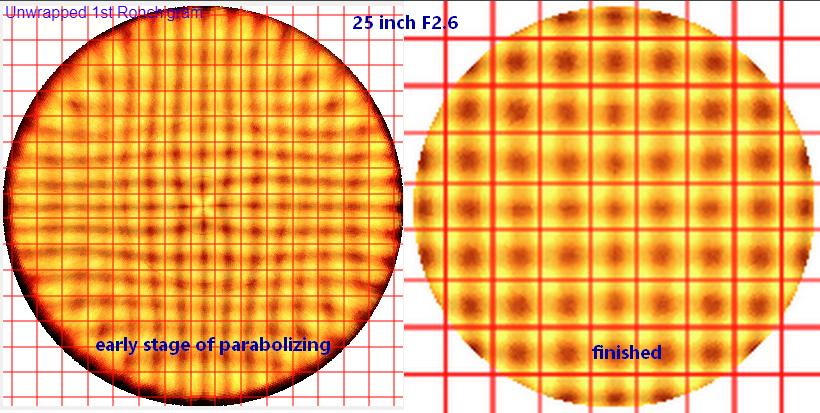
Two Matching Ronchigram Grid tests of my 25 inch [64cm] F2.6 mirror. The first while parabolizing was underway, the second when finished. Here I synthesized the grids by taking Ronchigrams vertically and horizontally, then combining them.
The Ronchi wire test
The Ronchi grating can also be used as a wire test. The following two Ronchigrams illustrate the 'phi' shape used in the wire test. For more on the lateral wire test, see the Cloudy Nights discussion.
Integrating the Ronchi test into the parabolizing process
Imagine taking a 2x6, measuring twice then cutting it on the chop saw. You take the stud and nail it in then move on to the next stud. Parabolizing a mirror is far more complex. So we break parabolizing down into a series of sessions. We also need to decide on a parabolizing strategy. We test the mirror each session, judging how the session went, what we will do next, and indeed, evaluating how our parabolizing strategy is proceeding.
We need to test for:
- Overall macro or large scale smoothness and lack of roughness. The Ronchi is ideal because we can see the entire surface at once.
- Zonal scale smoothness (kinks and zigzags). The Ronchi is ideal because we can see a kink or zigzag anywhere on the mirror surface.
- Turned edge. The Ronchi is very good at the edge, especially using masking tape to calm interference effects.
- Astigmatism and various distortions (mirror, test stand, tester, eye, camera). Here we need the 2D Ronchi grid or equivalent.
- Fit to ideal paraboloidal curve. The Matching Ronchi and Ronchi Tape Band can easily and without confusion, get us very close. Then finish and verify with the star test or the Bath IF.
My parabolizing process:
- Setting the stage:
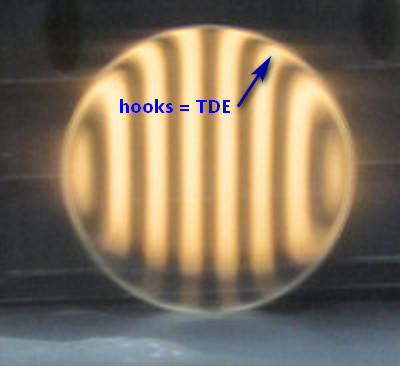
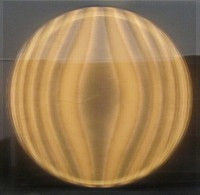
- Smooth out Ronchi bands, making mirror spherical, removing TDE.
- Make test stand:
- Check for astigmatism: rework test stand until none. No need to check again until the star test because I rely on my process to avoid astigmatism in the mirror.
- Select a parabolizing strategy:
- Begin parabolizing:
- Initially set the parabolic correction to 25% or 50%. Use the Ronchi to check overall smoothness. Use the Ronchi Tape Band to guide parabolizing. You can make bands for 25%, 50%, and 100% parabolic correction.
- Continue parabolizing:
- Up the parabolic correction to 100%. Continue using the Ronchi Tape Band test. Occasionally use the Matching Ronchi test as desired. Shorten parabolizing sessions.
- Mirror passes the snap focus star test:
- Once the bands match the tape and the mirror is smooth, verify that the mirror passes the snap focus test. Use the star test to check all errors from 'stig to overall parabolic correction to zones. No surprises after the mirror is coated and installed in the telescope.
- Finish parabolizing mirror:
- Continue until the star test looks as good as possible: I've hit the limit of my ability to parabolize.
For parabolizing, I use an iterative process:
- Formulate a figuring action. Select best fit grating offset based on:
- Minimizing overcorrected zones.
- Maximizing chance of success to polish the undercorrected zones.
- Least change to the pitch lap.
- Execute the action for the minimum time for a detectable change in the mirror’s figure (20 seconds to 2 minutes).
- Quickly test to see if the mirror’s figure is changing in the desired direction. The Ronchi Tape Band test is ideal, the Matching Ronchi best if the changes are very small.
- If so then continue on with the figuring action to its conclusion.
The Ronchi Tape Band is very direct: when the band falls short, polish more. That's it, don't need to know or care about anything else. And we only perform the 2 axis stig test to qualify our test stand at the start of parabolizing.
I concentrate on deviations from the ideal paraboloid, not worrying about a deviation’s hard numerical value, which would be the case if I were making the mirror to an explicit numerical rating.
The better the mirror maker, the better the process and the more the process can be counted to preclude mirror defects and deliver a good mirror. The zonal Foucault test used with a good process that suppresses astigmatism has been used for centuries to make unimpeachable mirrors. Neophyte mirror makers struggle with testing and figuring because they have not yet developed a parabolizing process. I advise obtaining the advice of a master mirror maker to establish a process - key to success.
See my pages on polishing and parabolizing mirrors where I discuss how to use the Ronchi test during figuring.
Polishing
Parabolizing
Class notes for the 16F3 master meniscus mirror making class
Analysis
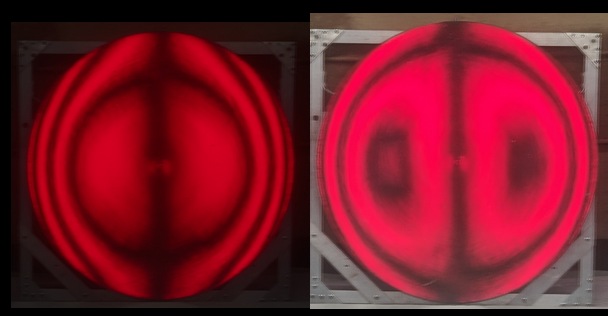
I use the Ronchi test in two positions: inside and outside the radius of curvature. I also use the Ronchi test dynamically, sliding the tester back and forth. This can reveal subtle issues.
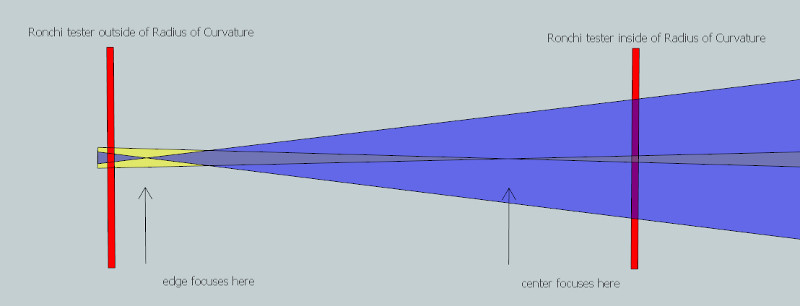
For a parabolized mirror when inside the radius of curvature the tester is closest to the mirror's center zones and furthest from the mirror's edge zones. And when outside the radius of curvature the situation is reversed: the tester is closest to the mirror's edge zones and furthest from the mirror's center zones.
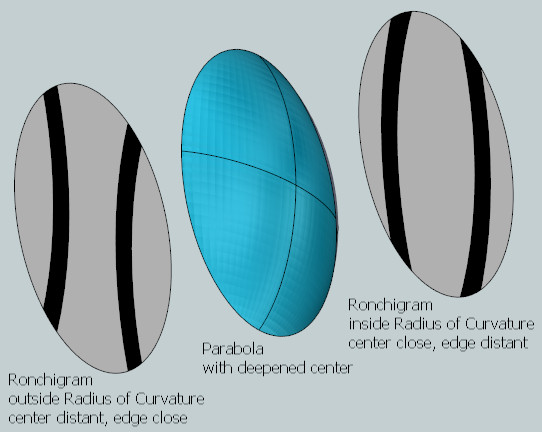
Here's a favorite visualization of mine. The paraboloidal mirror is concave at the radius of curvature by virtue of lowering the center (or equivalently lengthening the edge). A grating placed inside the radius of curvature will see the center closest, the edge farthest. Since the bands expand closer in and shrink further out, the bands will appear fattened in the center and tapered at the edge. A grating placed outside the radius of curvature sees the center farthest and the edge closest, resulting in the bands appearing thinner in the middle and spread out at the edge.
The edge rules
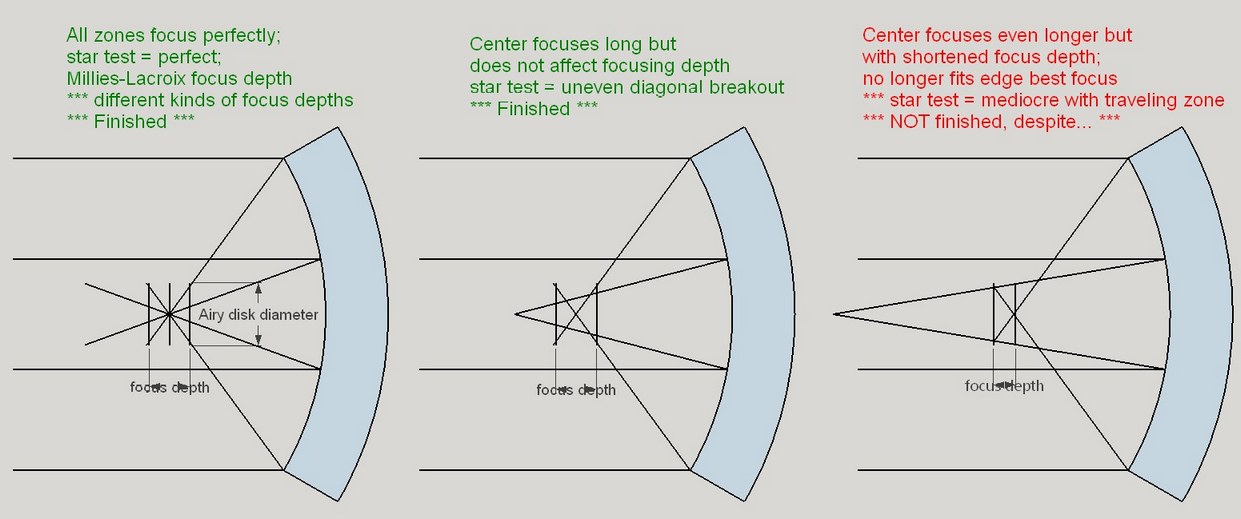
As the mirror's paraboloidal shape progresses, where should we match the nulled and thinned bands? Near the mirror's edge, as it turns out, especially so for large, fast mirrors. The reason lies with how we focus.
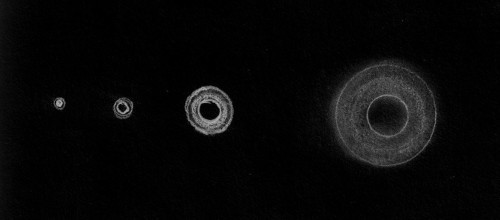
We focus using the disk of defocused starlight, shrinking it to the smallest dot possible. The edge of the disk of light, particularly when not that close to focus, corresponds to the edge of the mirror. The mirror's zones should be measured in relation to the focused edge then. And when the edge focus is compromised by out of compliance inner zones, then we can say that the mirror is unfinished and will focus poorly.
Here, the first two examples constitute a perfect mirror, then a good mirror. Note the wide focus depth. The third example shows the edge's focus is compromised by a high center - a poor unfinished mirror.
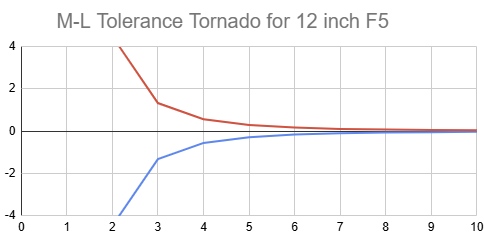
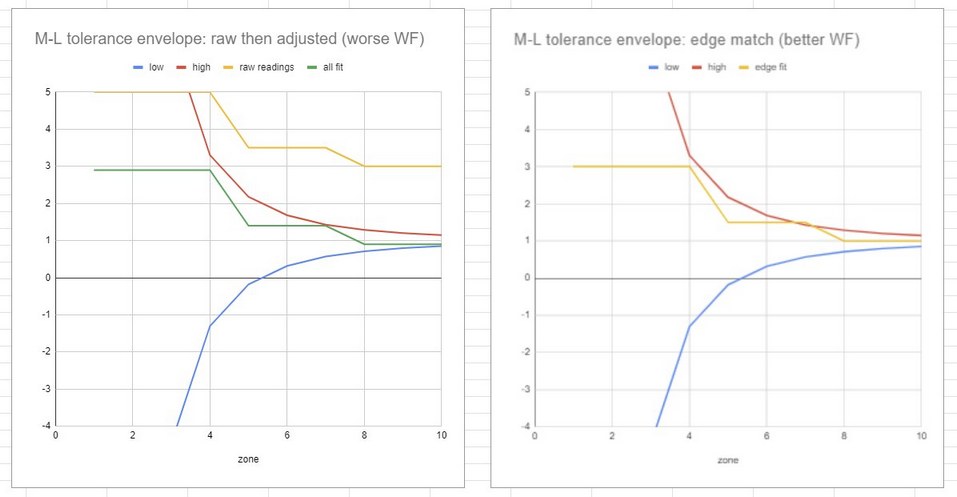
This behoves us to reconsider how to analyze Millies-Lacroix tolerances, suggesting that the M-L readings should be pinned to the edge zone's center, accepting that the other zones will fall as they fall because we focus the mirror's edge. On the left side we see the raw M-L slope measurements that are then adjusted for best fit. But the edge should actually be zeroed out per the right side graph.
Here is the corresponding star test, showing the high zone as we focus using the edge of the star disk.
Gross issues
A glance reveals the overall shape and gross errors of the mirror's surface, e.g., is the edge turned? Here's a quick comparison image showing a turned down edge in a 6 inch [15cm] mirror (be wary of diffraction effects at the edge; if necessary mask off a portion of the edge using blue masking tape).
Here is a mirror where the star test is essentially perfect, a 10.5 inch [27cm] F2.7:
To get the radius of curvature, measure from the mirror's center to the ruled side of the grating.
I like a grating of about 100 bars per inch [4 bars per millimeter]. Smaller slower mirrors can profit from a finer grating and large very fast mirrors from a coarser rating.
The Ronchi test can also be used far away from the radius of curvature. Here, any kinks in the bands will show as ragged bands or interference effects. The first example shows rough zones towards the edge; the second example shows smooth bands.
Testing for astigmatism
The Ronchi test can be used to detect astigmatism. When the mirror is spherical, position the grating so that a single band appears. Now slowly move the grating back and forth. Any 'S' shape is astigmatism which could be in the mirror, could be in the test stand, could be in the tester, could be in your eyes or glasses, could be a thermal gradient. If a 'S' is seen, try re-seating the mirror. The single Ronchi band should appear consistent - rather hard to achieve for thinner mirrors with mirror cell issues. Finally, rotate the mirror 45 degrees to the left and repeat, then rotate the mirror 45 degrees to the right and repeat.
If you see an 'W' shape then determine the two stig axes, long and short, by orienteering the grating so that either the 'S' disappears (the stig axes are oriented vertically/horizontally) or the 'S' is maximized (stig is oriented @ 45 deg). If you are inside RoC, then the short stig axis is denoted by the thickest Ronchi banding. Use a small polisher with short strokes on the short stig axis towards the edge.
Diffraction effects
In some situations diffraction effects can be annoying, even obscuring results. You can
- Find a grating that suppresses the diffraction effects.
- Use the grating at a Talbot position.
- Study the diffraction pattern itself, which can reveal subtle zones.
The dynamic Ronchi
It can be quite revealing to dynamically move the grating back and forth. Small discontinuities that hide in the static Ronchigram reveal themselves. Astigmatism in the form of the bands twisting is easiest to see.
The Ronchi test at the focuser
The Ronchi test can be used at the telescope's focus. As such it measures the entire optical system including all optics, thermal issues and seeing conditions. This test is commonly thought to be rather crude, in that any deviation from straight bands means a significant error. Used casually such a test ferrets out poor quality mirrors that have trouble with critical high magnification planetary and lunar viewing. At focus the test is half as sensitive as at the radius of curvature or at focus with an auto-collimating flat in the shop. But under the hypothesis that it is the optician that makes the mirror, not the test, can the Ronchi test at focus be used more critically?
It is possible to extract critical information using a quality grating of greater than 100 bars per inch (lpi) [4 bars per millimeter] under good seeing conditions and thermally stabilized optics if the grating is slowly racked back and forth focus where one to three bands cross the illuminated disc. It is critical that the tester have experience judging how the Ronchi bands change dynamically. With care defects to 1/10 wavefront are detectable.
Pitfalls
- Comparing the mirror's Ronchigram with the computer generated Ronchigram by looking back and forth. This will not work the way you think it will: it is too inaccurate. Experienced amateurs with trained eyes might make this work in certain circumstances. Using the Matching Ronchi Tape band or copying and pasting into the Matching Ronchi software is easy and accurate. Though of course, the bands' smoothness can be judged in isolation.
- Not judging the mirror Ronchigram's bands critically. The bands must fit exactly within the computer generated bands. See examples below for the visual exactness required.
- Not knowing the grating's frequency (bars per inch) or the mirror's exact radius of curvature or its clear aperture to a tenth of an inch [2-3mm]. Be careful how the grating is measured: occasionally the manufacturer will count both opaque and transparent lines, doubling the line or bar count.
- Using too coarse or too fine of grating. For most mirrors a 100 LPI is very good; for smaller slower mirrors a 133 LPI is better; for larger faster mirrors a 65-85 LPI is better.
- Ronchigrams need to be sharp with good contrast, centered, rotated vertically and cropped.
- Not pairing the Matching Ronchi test with another test that is sensitive to overall correction, like the star test or Hartmann test or Bath IF.
- Not grokking that the Matching Ronchi is best used as an integral part of the parabolizing process.
- Using a pinpoint light source. The Ronchi test works better with a diffuse light source: the return is brighter and easily located.
- Testing at the telescope's focus in place of the eyepiece is half as sensitive as testing at the radius of curvature. Detecting any curvature at focus means a poor mirror.
Ronchi math
Interestingly, we need only two parameters: the ratio of grating size to the mirror diameter, and the focal ratio of the mirror. This because what counts is the characteristic of the parabolic curve, that is, what portion of the parabolic curve should we fit to the mirror.
The characteristic of the parabolic curve is defined by where the mirror zonal slopes cross the mirror axis. This characteristic depends on two factors: mirror aperture and mirror focal ratio. Each combination of aperture and focal ratio creates a unique characteristic. The projection of this characteristic depends on the offset and grating frequency. Moving the grating back and forth acts to zoom in and out the appearance as does changing the grating frequency. These actions do not change the characteristic. Since we can define the grating frequency as the number of grating bars across the mirror's aperture, we can consolidate this characteristic to two values: focal ratio and number of grating bars across the aperture.
For example, open two Ronchi tabs so that you can toggle back and forth. Leave one at the default, and set the other to a 6 inch F3.5 with -0.1388 grating offset. Notice that the edge bands are identical but that the center changes ever so slightly. Here's an example of 'exact'. As above, except use these numbers for the 2nd tab: 6", 200 grating frequency, and then cut the offset down by half to -0.1. Identical because the bars across the aperture are the same 1200 as the opening tab.
Any test that produces slope measurements can be used in the Ronchi Calculator, including Foucault, Hartmann and the Wire test, just to name a couple of examples. Create a graph of the measurements and input it into the calculator, or, match the zonal readings to the Ronchi Tape band. This then leads directly to the art of parabolizing or figuring the mirror, where we choose the best fitting parabola that has the least glass to polish with the highest chance of success.
Geometrically, Ronchi math is all about calculating which light rays make it through the grating.
I use an algorithm that starts with the mirror, since this is where the Ronchi bands appear to rest upon. The Ronchigram is displayed with a particular size using pixels. Taking each pixel in turn (the x, y location of the pixel measured from the mirror's center) that lies within the mirror's perimeter, I calculate the mirror's zone for the pixel then that zone's radius of curvature. This gives me a triangle. I look at the grating's offset from the zonal radius of curvature and using similar triangles, determine if the light ray coming from the mirror makes it past the grating. Grating positions behind the zonal radius of curvature result in the same triangle. By convention, if the light ray makes it through, then its pixel on the mirror's face is marked. The data array of mirror pixels (x, y, visible or not) is then easily manipulated, eg, to invert the bands, to calculate the band's center, or to create a Ronchi-Hartmann like grid. Also, the zonal radius of curvature can be changed per the parabolic correction desired and further by the zonal error correction set by the user. One quadrant of the mirror is calculated, then applied to the other three quadrants.
Since the zonal radius of curvature depends on the mirror's zone, the triangles for each zone have differing angles. Consequently, determining the mirror's zone from the grating results in a complex cubic equation that is computationally expensive. Not to mention that working from the grating to the mirror will leave gaps on the mirror's face to be filled in by interpolation.
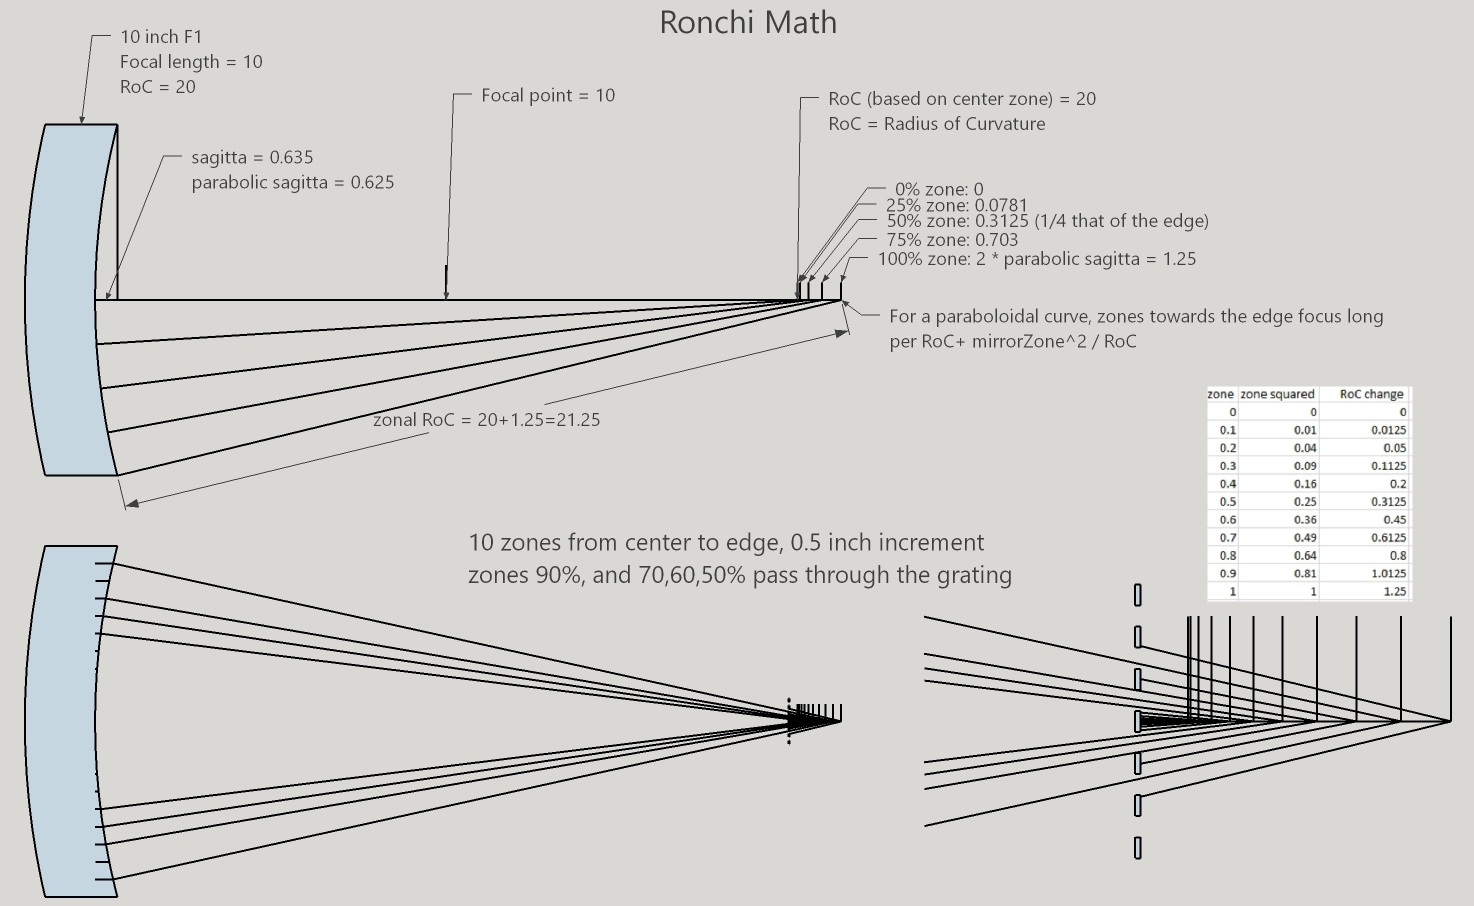
The equation determining the light ray's height at the grating is (RoC = radius of curvature) (light source moves with grating):
xAtGrating = abs((RoC + gratingOffset * 2 - zonalRoC) * x / zonalRoC) where zonalRoC = RoC + (x * x + y * y)^2 / RoC
xAtGrating = abs((RoC + gatingOffset * 2 - RoC + (x * x + y * y)^2 / RoC) * x / (RoC + (x * x + y * y)^2 / RoC))
Refactoring this extensively in order to solve for the pixel's 'x' location leads to this complex cubic equation:
x^3 - x^2 * xAtGrating - x * (RoC * gatingOffset * 2 + y^2) - RoC^2 * xAtGrating * (y^2 + 1) = 0
If y=0, then simplifies to x^3 - x^2 * xAtGrating - x * RoC * gatingOffset * 2 - RoC^2 * xAtGrating = 0
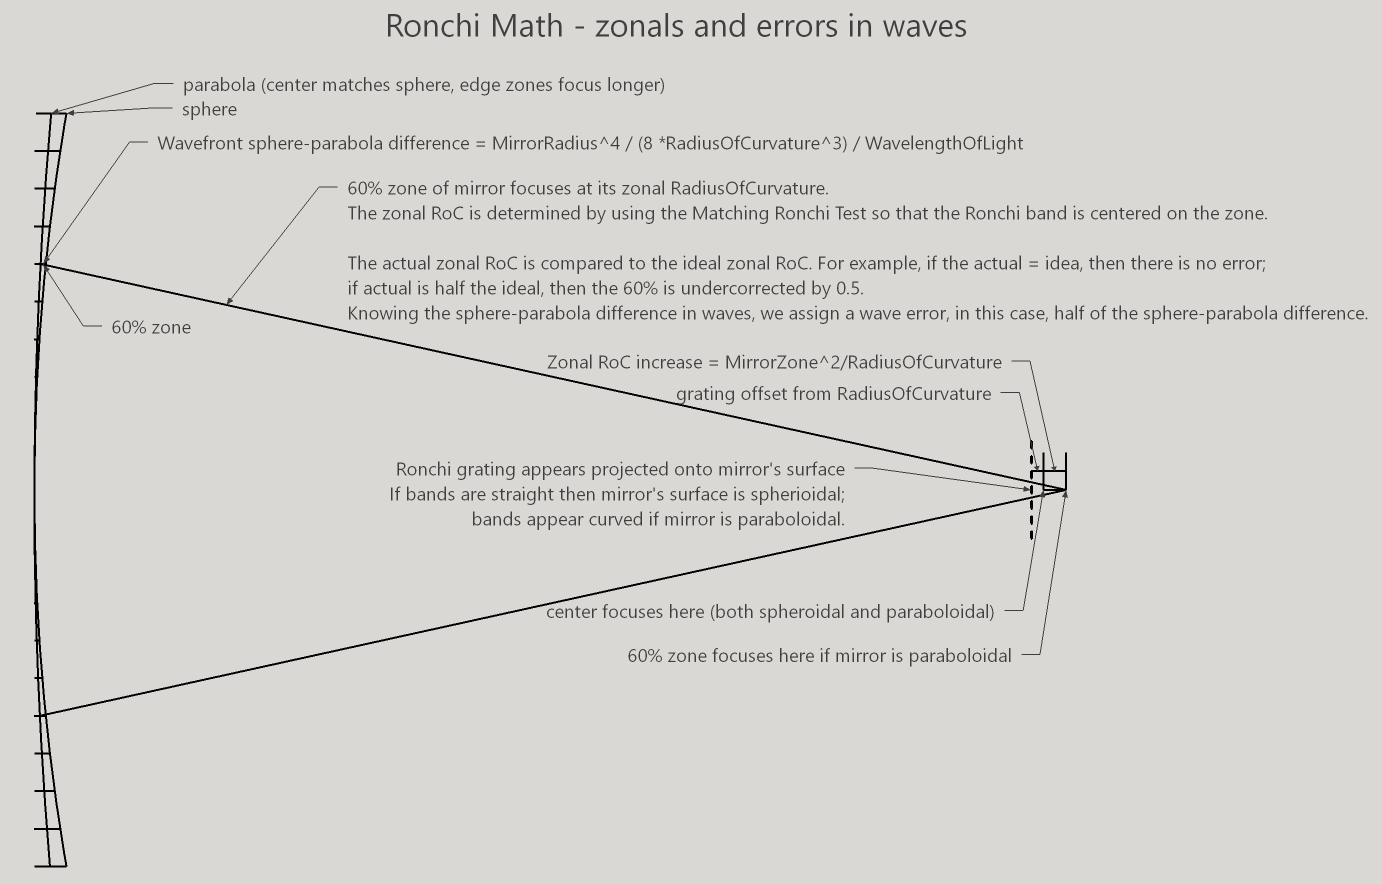
Mirror Zonal Errors Profile math
The radius of curvature for each zone is calculated along with the sphere to parabola deviation in waves at focus (the wavefront). The ideal RoC offset is compared to the user input zonal error corrections. For example, if the user sets the parabolic correction to zero, then the wave error is the full sphere to parabola deviation for that zone.
Nulling the Ronchigram
Nulling the Ronchigram means removing the parabolic distortion. Straight vertical evenly spaced bands indicate a paraboloidal mirror surface. Software nulling turns the Matching Ronchi into a version of a null test with straight bands (without the doubled sensitivity of a null test).
To start, we compare the ray height at the grating for parabolic and spherical surfaces to get the distortion ratio. We then apply the distortion ratio to the original image's x,y pixels shifting the pixels by the distortion ratio. If inside RoC, then the pixels are shifted inward.
The spherical surface has a constant factor of gratingOffset * 2 across all zones, resulting in straight bands. Whereas the paraboloidal surface factor is:
(RoC + gratingOffset * 2 - zonalRoC) * zoneLocationOnMirrorSurface / zonalRoC
where zonalRoC = RoC + mirrorZone^2 / RoC.
Parabolic distortion then = paraboloidal factor / spherical factor. These values are saved for all x,y in a quadrant of the Ronchigram.
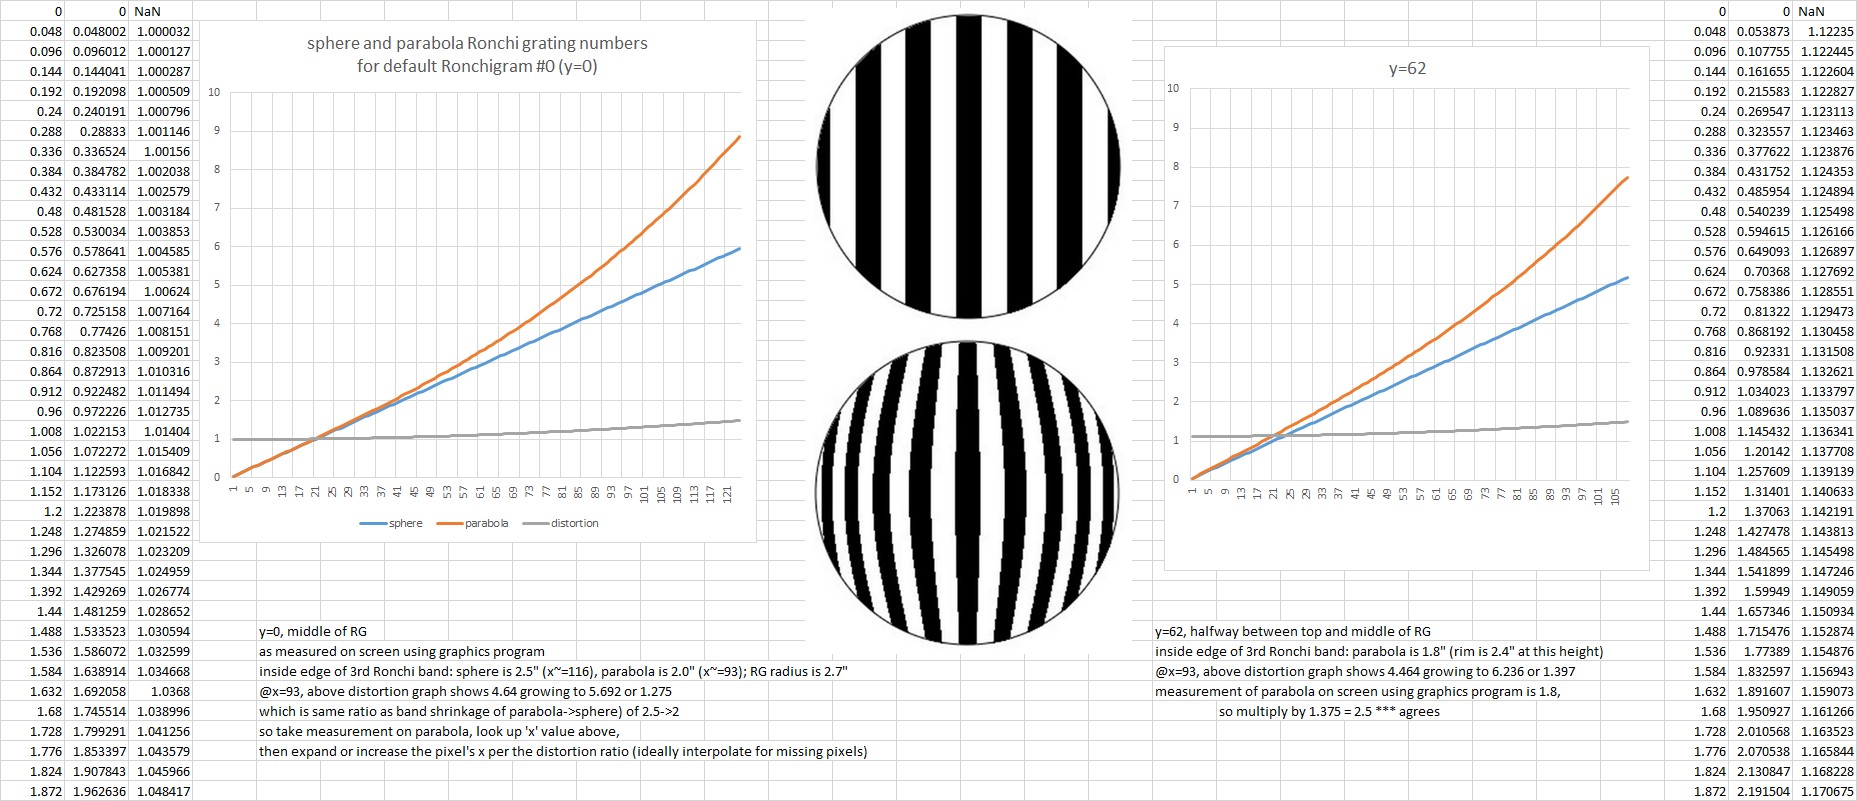
For example, the default Ronchi tape bands fall on the 0, 2.62, 4.34, 5.54 mirror zones. That's 0, 0.4366666666666667, 0.7233333333333333, 0.9233333333333333 relative to the mirror's radius.
The default Ronchigram display display size is 250x250 or 125 for the radius. The bands then fall on the 'x's: 0, 54, 90, 115. These are parabolic or warped x's as they appear in the first Ronchigram.
The Distortions for the bands are: NaN, 1.1394363845604456, 1.3870024448314904, 1.6313480674892065 and when divided by the maxDistortion of 1.733782617356102 for the Ronchigram overall, are: NaN, 0.6571967980034353, 0.7999863598509095, 0.9409184583802662.
The nulled or undistorted 'x's: 0, 54, 90, 115 then become: 0, 35, 71, 108.
The original Ronchigram + pasted image's pixels at x's of (0, 54, 90, 115) are pasted to x's of (0, 35, 71, 108) in the new nulled Ronchigram. Here, in this example, the 'y' axis is set to zero.
This is done for each x,y value in the distortion data array; to fill in otherwise missing pixels, the distortion data array is enlarged by the 'null fill factor'.
Here are two plots of the parabolic distortion of the default first Ronchigram where 'y=0' is across the mirror's center and 'y=62' is halfway towards the top edge:
Other Ronchi math
An article on the Mosby Null test including some Ronchi math can be found at http://bobmay.astronomy.net/misc/mosby.htm.
by Mel Bartels, 1992; last update 21-April-2025